When your team is communicating about the mission of your organization, they reach into the hearts and minds of the audience to tell stories, make connections, and share updates.
You may be surprised that visualizing data isn’t much different. Data visualization is the art of accurately presenting data in a way that captures the viewer’s attention and leads them to take action. As Computer Science Professor, Ben Schneiderman, said, “Visualization gives you answers to questions you didn’t know you had.”
Here are a few ways you can leverage data visualization to maximize the story-telling power of your team.
A picture is worth a thousand words
Research has identified that the human brain processes visuals 60,000 times faster than text. It’s especially important to leverage this behavior when discussing important topics like annual strategies, campaign performance, and budgets.
To begin creating visualizations that serve your team well, start with defining the purpose of the report. Creating a clear definition prevents the visualization from becoming too crowded with multiple needs. If stakeholders have multiple needs, create multiple visualizations. It’s more effective to have multiple visualizations that serve a specific purpose than just one or two that are overly complex.
When the visualizations represent the performance of the primary KPIs of your organization, it allows you to weed out visualizations that are just interesting from those that truly drive action and results. When trying to decide if a visualization needs to be created, ask yourself, what are we going to do with this information? If there is not a clear answer, deprioritize that visualization until you’ve got some extra free time.
Seeing is believing
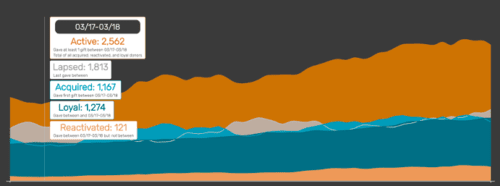
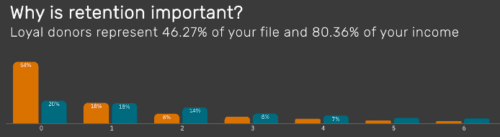
Data visualization creates simplicity from the complex. When everyone has the appropriate access to empower decision making, they are able to notice patterns, see relationships between activities, and identify outliers.
It’s important to ensure that your story is accurate. Incorrect conclusions can be drawn if the visualization is distorted. Here are a few common mistakes to avoid:
- Ambiguous or misleading colors
- Size and spacing that misrepresents facts
- Excessive or omitted data
- Exaggerating or minimizing scale
- Choosing the wrong visualization type
- Only highlighting favorable results
Is your story interesting?
Not only should you create accurate visualizations with a defined purpose, but it’s also important to make them beautiful. Optimizing the user experience allows you to engage key stakeholders that allows everyone to access and understand the data they need quickly.
Here are a few tips to maximize your data visuals:
- Optimize the user experience by displaying the most important information first and keep subsequent details within a drilldown or accessible on a different page that can be accessed if needed.
- Similar to a website, ensure your visuals are responsive and accessible. This includes, but is not limited to, mobile optimization, colorblind-friendly palettes, and easy-to-read fonts.
- Each stakeholder may want to see a different view without excessive scrolling or clicking into multiple other areas. Consider providing functionality that allows them to sort and filter easily. You can also maximize how the viewer engages with the visuals by ensuring that nomenclature and definitions of the data are clear and consistent.
Your data tells a story. Get the insights you need for an effective fundraising growth strategy at DunhamInsights.com.